tmap
Visualize large high-dimensional data sets as interactive plots using C++, Python, or R.
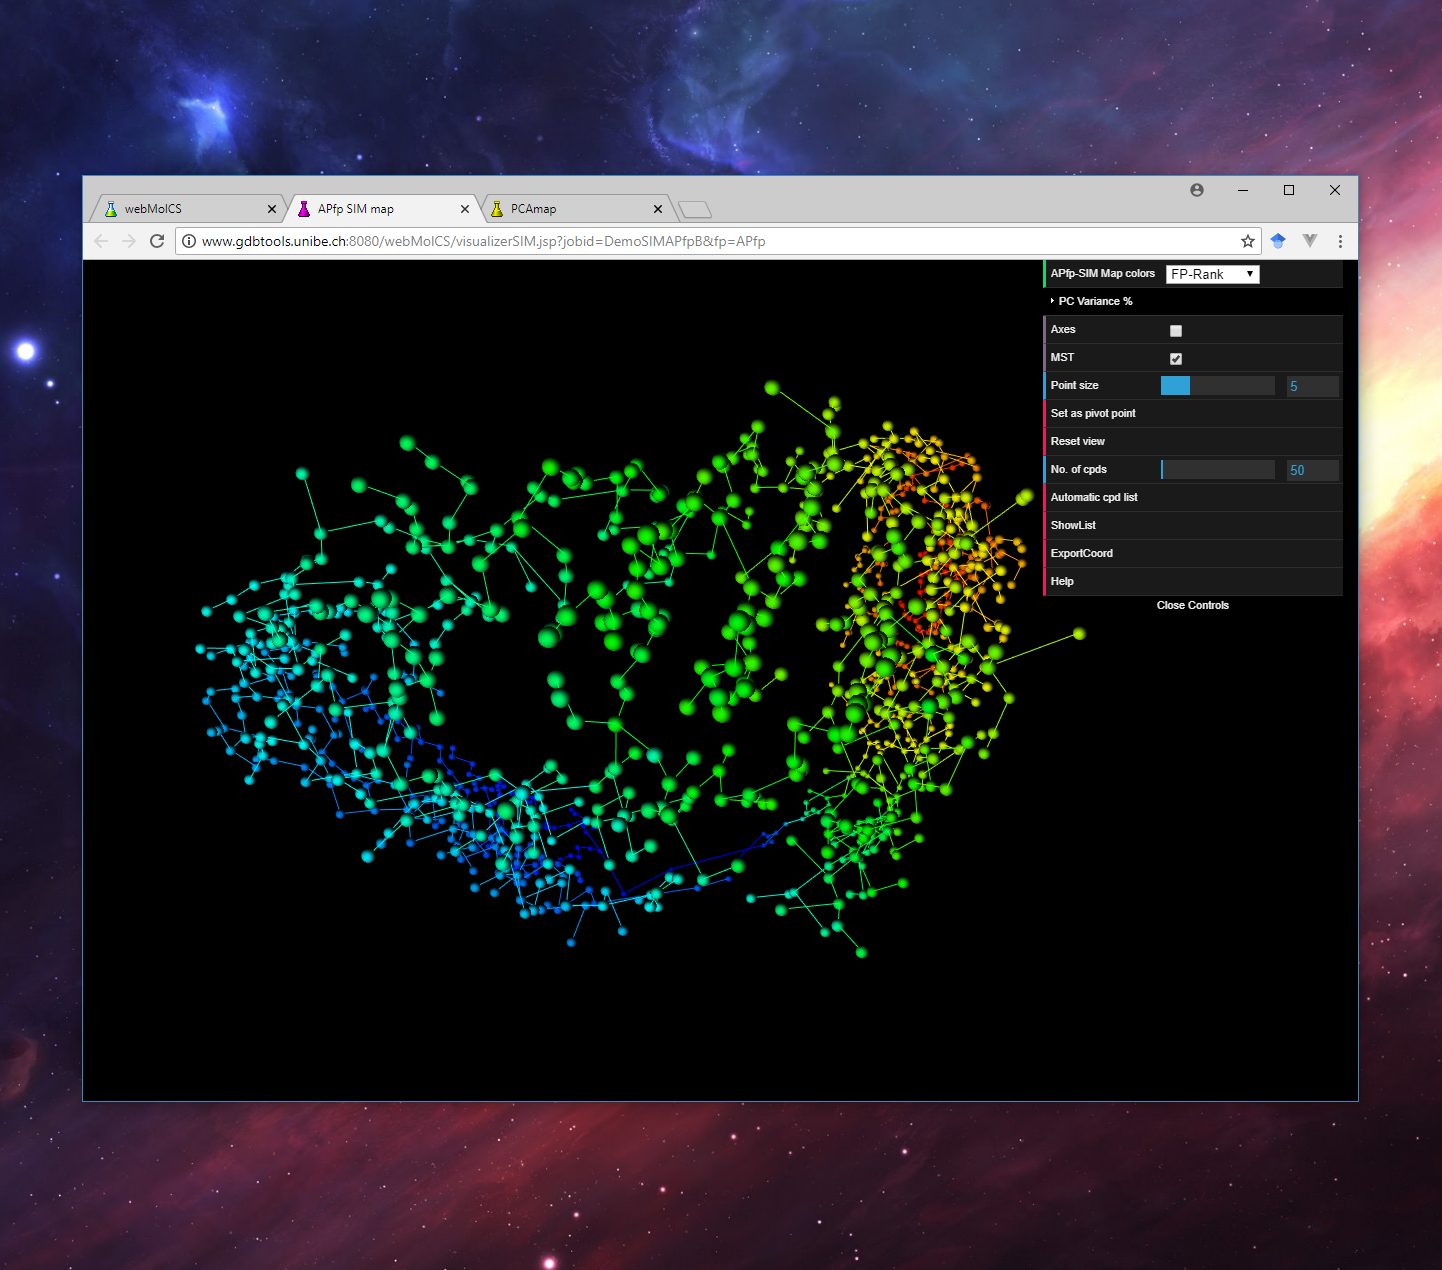
A collection of Chemical Space Visualization tools developed by the Reymond Research Group at the University of Bern, Switzerland.
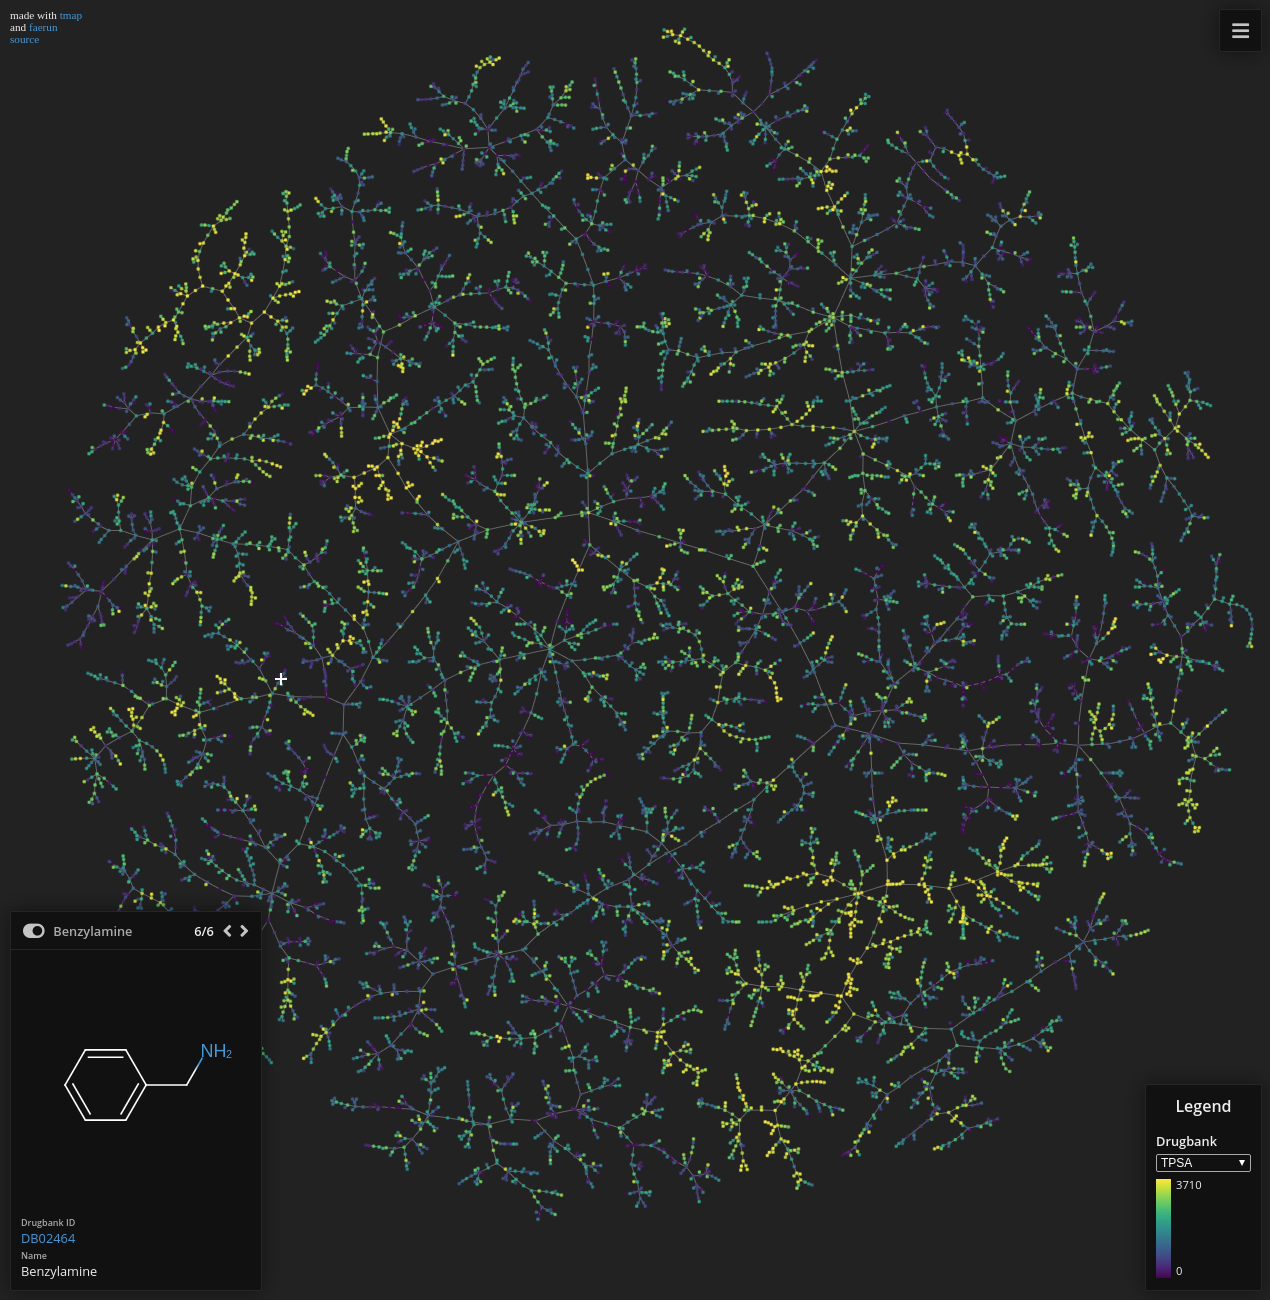
Visualize large high-dimensional data sets as interactive plots using C++, Python, or R.
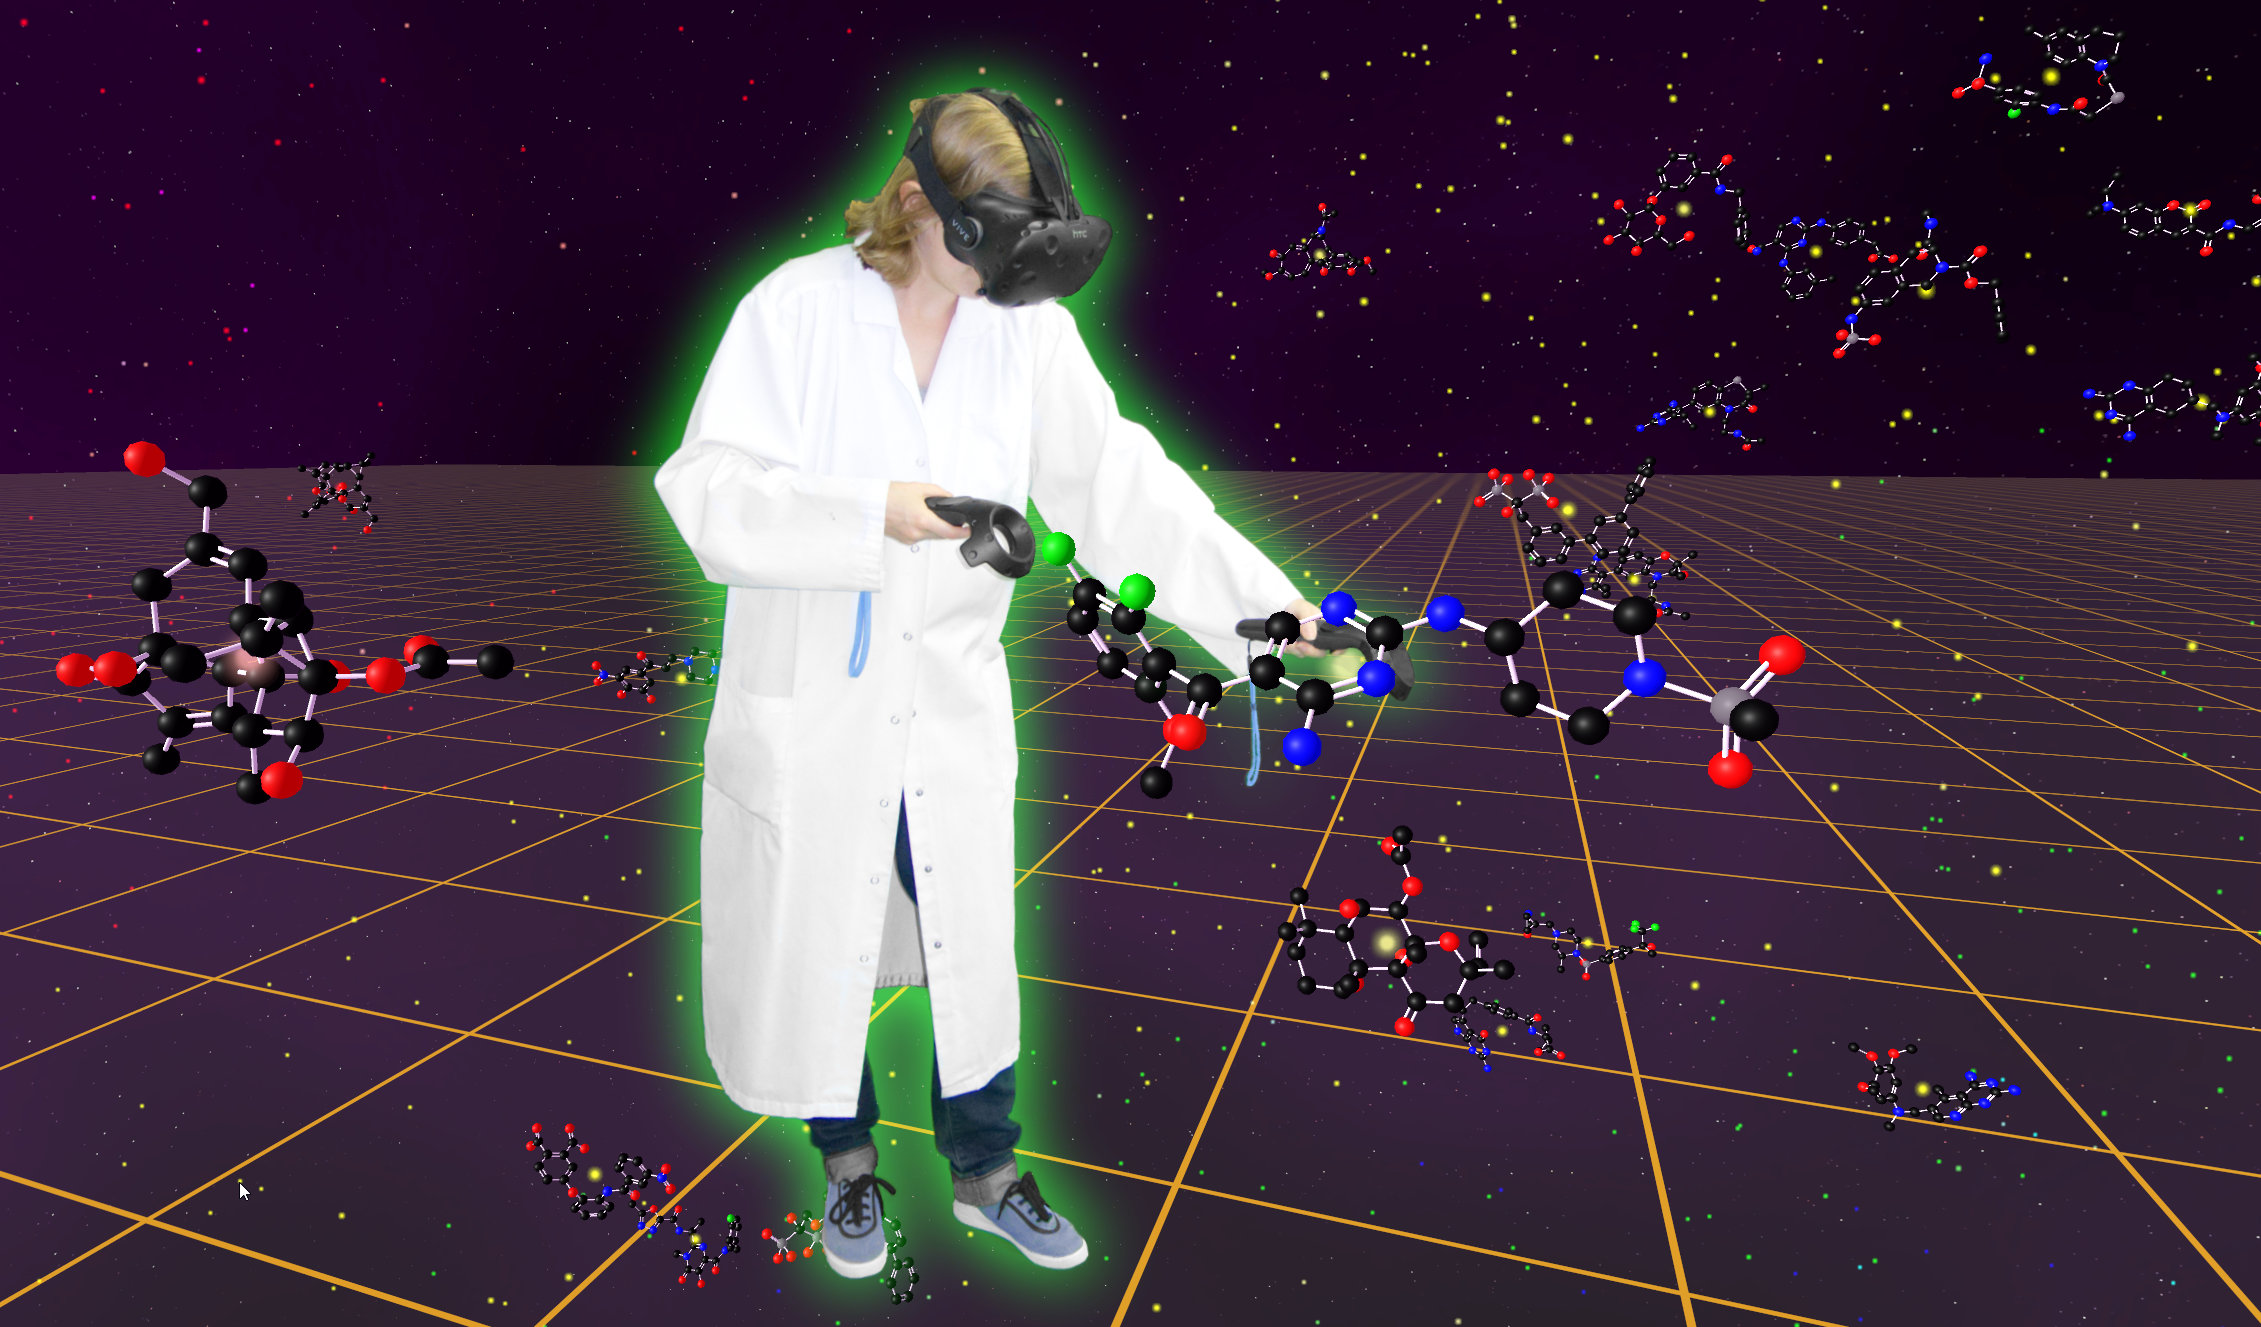
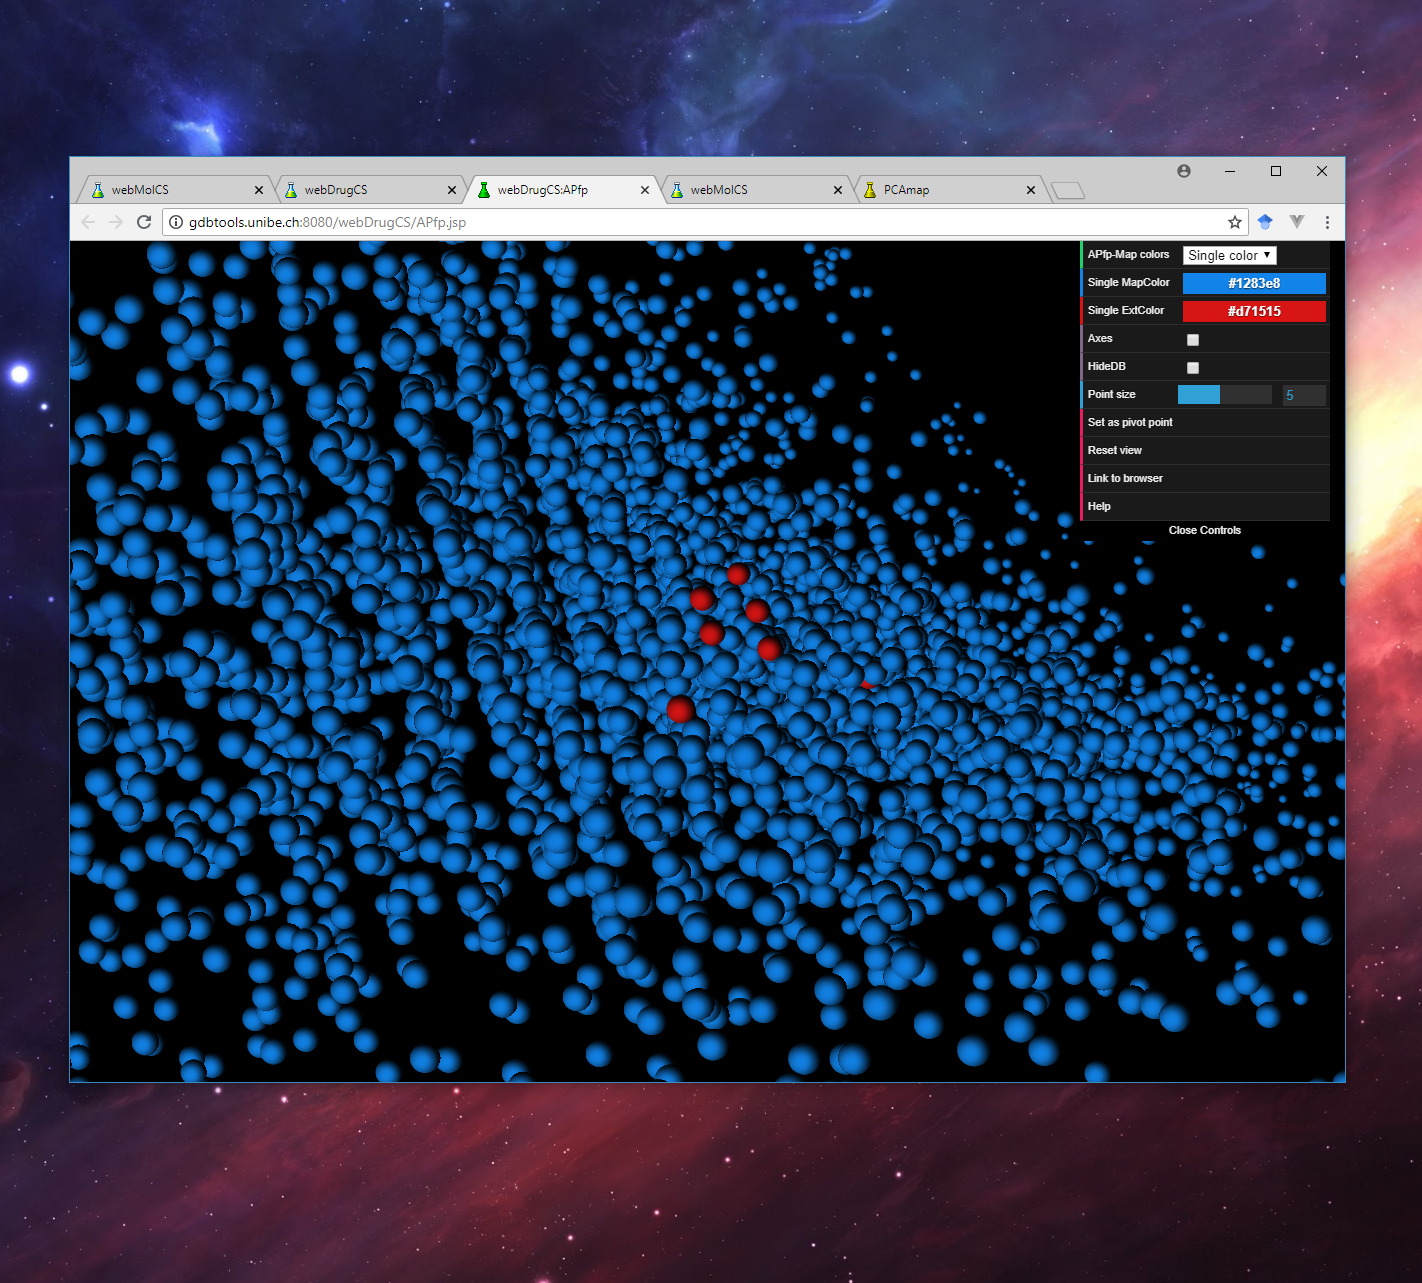
Explore Drugbank in Virtual Reality Chemical Space using an Oculus Rift or HTC Vive VR headset.
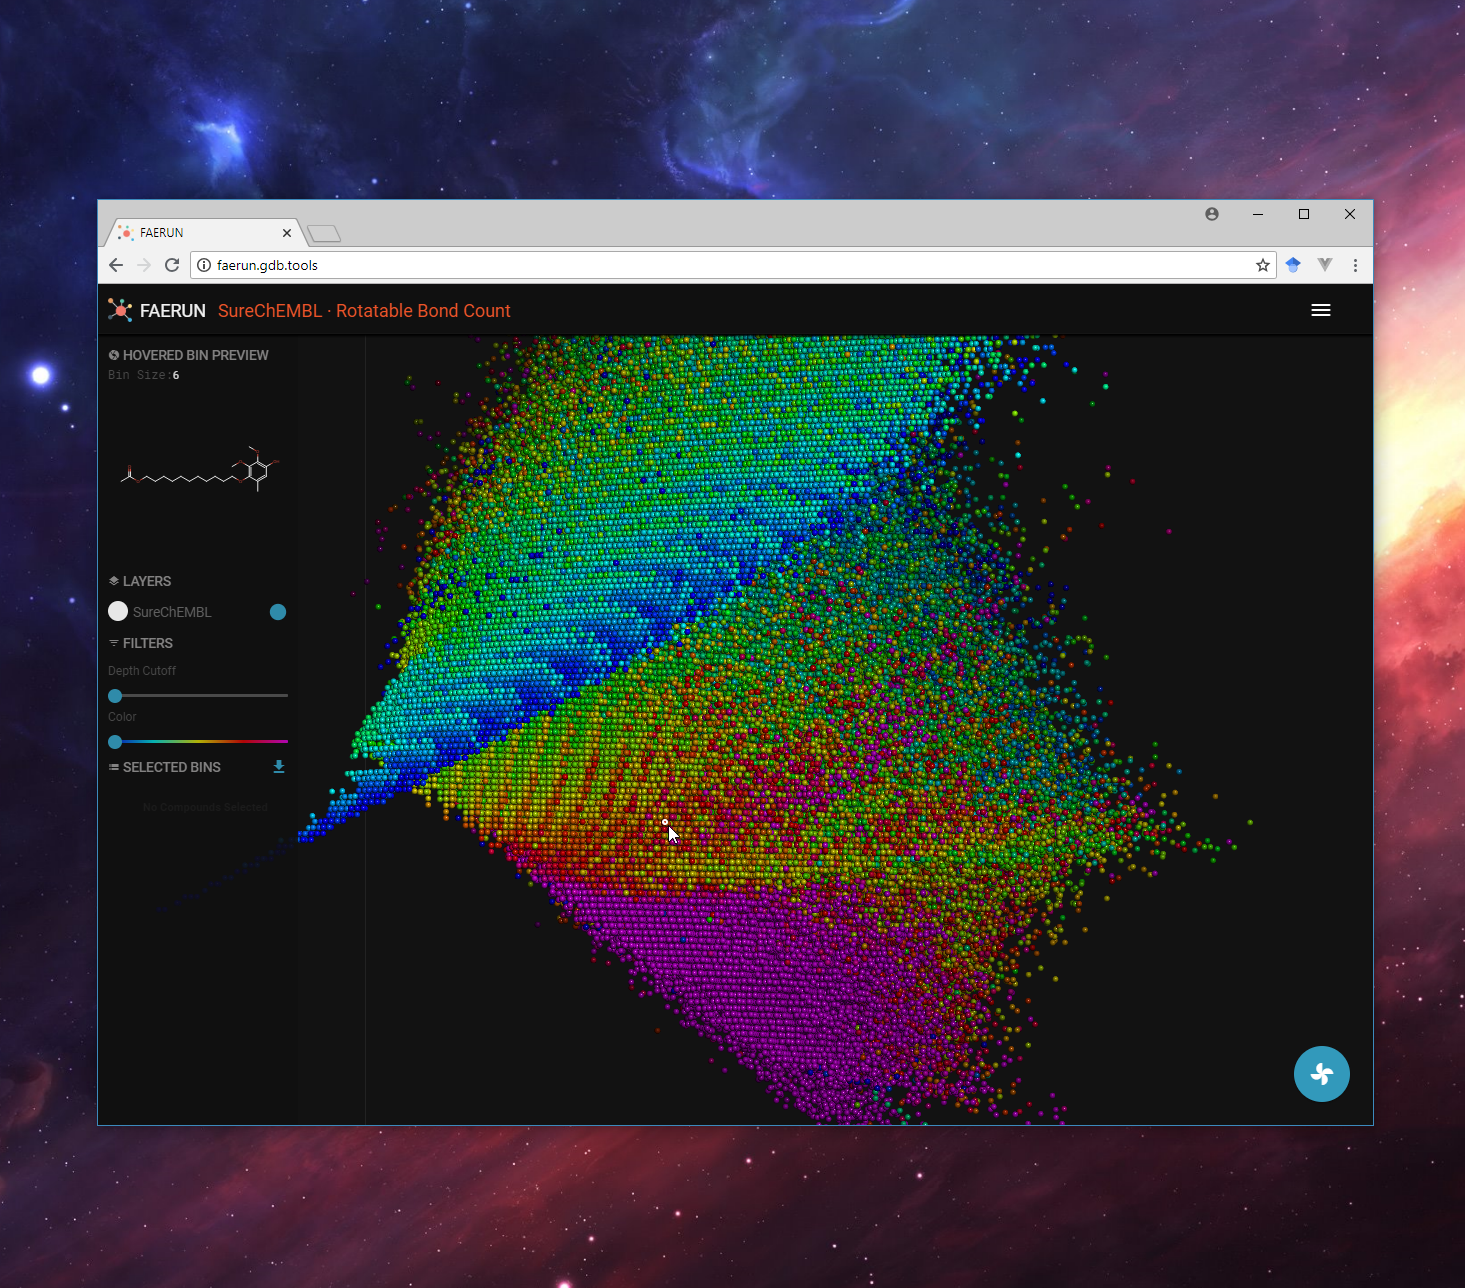
Visualize databases containing millions of molecules, while maintaining exceptional performance. The application is completely open source (MIT), including the pipline required to prepare the data for exploration.
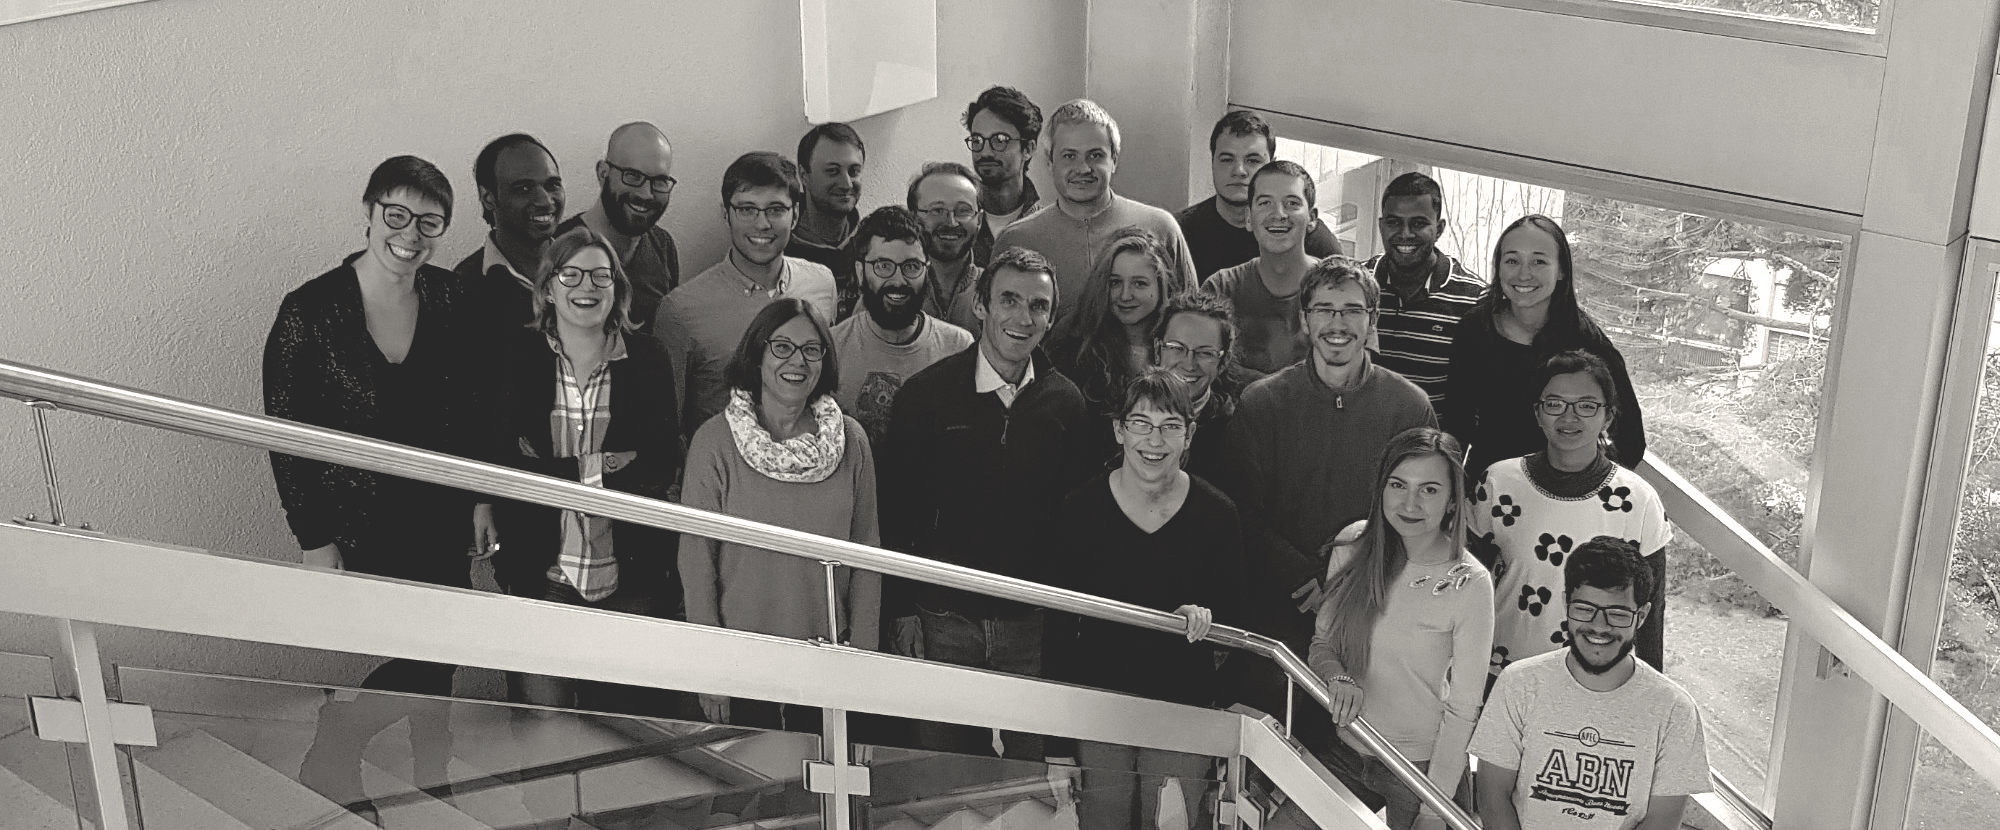
The Reymond Research Group is based at the University of Bern in Bern, Switzerland. You can find out more about our current and past research by visiting our group website.
You can follow us on twitter or facebook. Check out our most recent software releases on github.